
SD5913 · WEEK 04
Interfaces
One control, one clear response.
SD5913 · WEEK 04
Interfaces
One control, one clear response.
SD5913 · WEEK 04
Today
01
Your first plot, and the final vote for our mark
02
Turn a picture into something a person can use
03
One action travels through a Streamlit app
04
Waiting, polling and callbacks
05
APIs: tide records and a generated image
06
One test, the workshop and Assignment 2
QUESTION · Image upload
Upload your first plot.
Caption, 50 characters or fewer: phenomenon · source
SD5913 · THE MARK
The class vote: three finalists
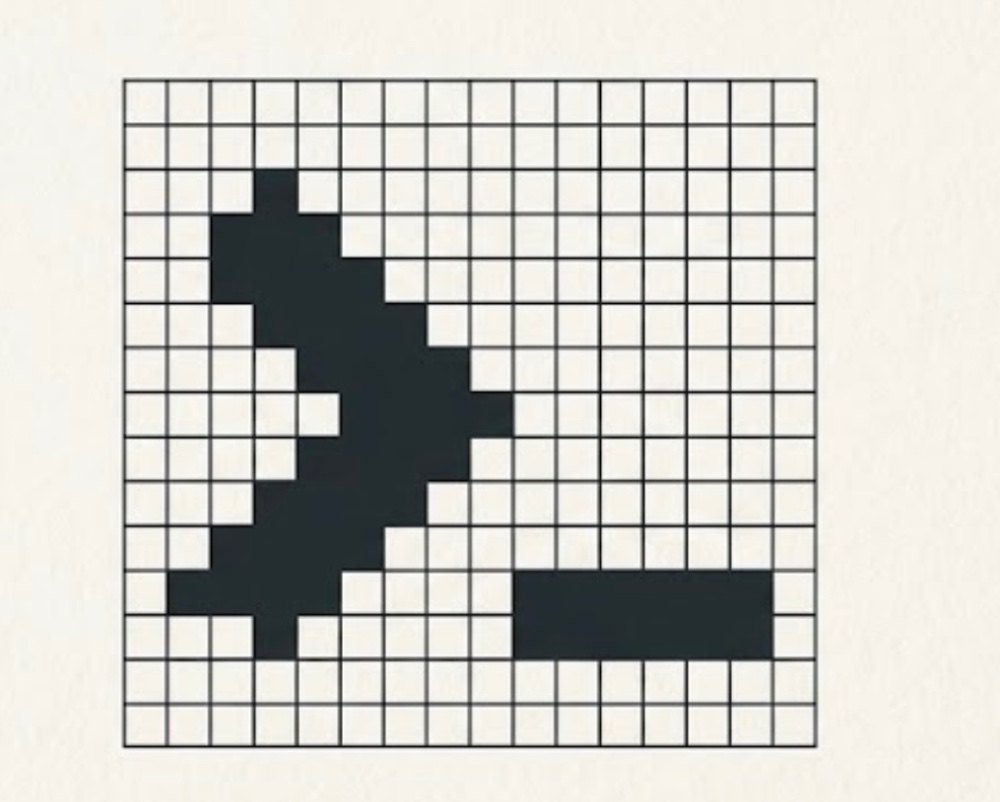
Mark 38
Score 4.04
28 wins · 5 losses · 33 comparisons
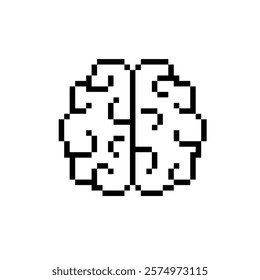
Mark 04
Score 3.40
27 wins · 6 losses · 33 comparisons

Mark 18
Score 3.01
26 wins · 7 losses · 33 comparisons
THE FINAL THREE
Which mark should represent SD5913?
A — Mark 38
B — Mark 04
C — Mark 18
SD5913 · WEEK 04 · WORDS
Four words for one interaction
interface — the part of a program a person can see and use.
input — information or an action a person gives the program.
state — what the program remembers between actions.
response — the visible result of an action.
More words appear when they have a job: sd5913.github.io/teaching/glossary.html
01
The surface
See the complete interaction before opening the code
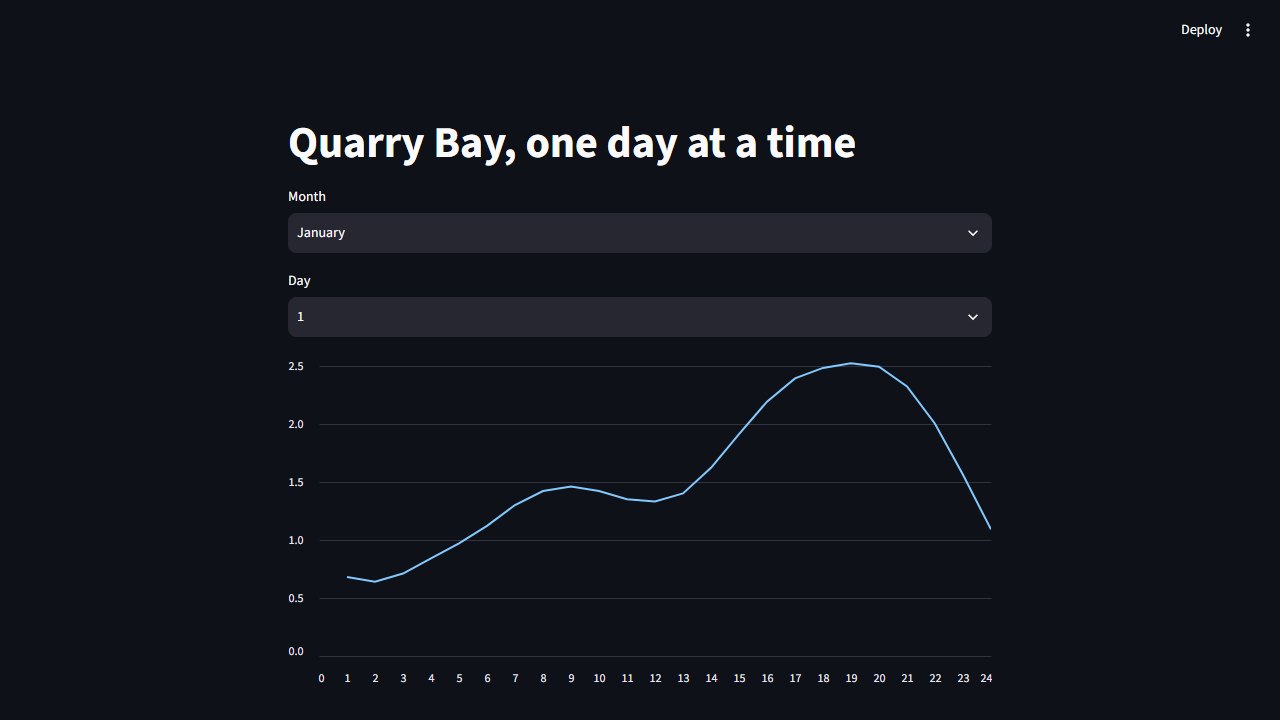
01 · THE WORKING APP
Choose a day. See its 24 hourly tide heights.
01 · THE SCOPE
One control, one clear response.
01 · THE PROMISE
“When I choose a day, the chart shows that day’s 24 hourly tide heights.”
01 · INPUT, STATE, RESPONSE
After someone chooses day 17, what is the state?
A
The mouse click
B
17
C
The 24 plotted heights
D
The JSON file
02
One action through the app
The selector supplies a value; the chart uses one record
02 · MEET STREAMLIT
Streamlit: a surface in Python
An open-source framework for turning Python scripts into interactive data apps.
Add controls, use their values, and show charts or tables.
Today: a month selector, a day selector, and a tide chart.
PROJECT streamlit.io
What it makes, with examples to explore.
SOURCE github.com/streamlit/streamlit
The code, issues, and release history.
Understand widgets and script reruns.
Find selectors, charts, and worked examples.
02 · THE PATH
Three parts of the interaction
input
A person chooses
The day selector supplies 17.
state
The app keeps the value
The current run sees day = 17.
response
The surface changes
The chart draws that record.
02 · THE EXACT CODE
The value reaches the chart
17 — the selector returns a day.
One record — select_day finds it.
24 heights — the chart draws them.
day = st.selectbox(
    "Day", [r["day"] for r in rows]
)
record = select_day(rows, day)
chart = pd.DataFrame(
    {"Height (m)": record["heights"]},
    index=range(1, 25),
)
st.line_chart(chart)
02 · STREAMLIT
A changed widget reruns the script
When someone changes a selector, Streamlit runs the script again from top to bottom.
The widget keeps its selected value. During the new run, day contains that value, select_day returns a different record, and the chart is drawn again.
This rerun model belongs to Streamlit. Other interfaces handle events differently.
03
Waiting and events
Blocking input, a repeated check, or a response function
03 · BLOCKING INPUT
One line waits
A command-line prompt stops at input() until a person answers.
That works for a short conversation. It does not work for a screen that must keep drawing or respond to other actions while it waits.
name = input("Name? ")
print("Hello", name)
03 · POLLING
Check, update, draw. Repeat.
A loop checks input during each frame.
At 60 fps, the whole cycle has about 16.7 ms.
A slow update delays the next check and the next frame.
while running:
    events = check_for_events()
    update_state(events)
    draw_frame()
03 · THE BROWSER EVENT LOOP
An event becomes a visible change
03 · CALLBACK
Connect an event to a function
Event: the click.
Callback: update_chart.
The toolkit calls your function when the event arrives.
def update_chart(event):
    day = day_picker.value
    record = select_day(rows, day)
    chart.show(record)

button.on_click(update_chart)
03 · THREE PATTERNS
Match the response to the program
command line
Wait
Ask once, then continue.
continuous picture
Poll
Check input during every frame.
discrete action
Callback
Run a function when an event arrives.
03 · WEEK 01 REVISITED
The semester loop
In week 1, this was a picture of a semester: keep working while the semester is on, then respond to the current problem and state.
Now the loop has a technical meaning. It checks a condition, updates values and decides what happens next.
while semester() == 1:
    problem = current_problem()
    try:
        problem.solve()
    except:
        simplify(problem)
03 · WAITING AND EVENTS
Which pattern best fits a browser button?
A
Blocking input
B
A callback
C
A 60 fps loop
D
A file refresh
04
Frontend and backend
Two examples, two data paths
04 · FRONTEND / BACKEND
Two places, one conversation
04 · STREAMLIT · ONE PYTHON APP
Streamlit connects the two sides for you
04 · FRONTEND · JAVASCRIPT
Ask, read, then draw
Ask for September records.
Read the JSON reply.
Draw one day in the browser.
const response = await fetch(
  API + "/tides?month=9"
);
const rows = await response.json();
const record = rows[0];

drawChart(record.heights);
04 · MEET FASTAPI
FastAPI: a service in Python
An open-source framework for building HTTP APIs in Python.
Connect a URL to a function, validate inputs, and return structured data.
Today: ask for a month and receive its tide records as JSON.
PROJECT fastapi.tiangolo.com
The framework and its documentation.
SOURCE github.com/fastapi/fastapi
The code, issues, and release history.
Create a route and explore the /docs page.
Query parameters and validation
Read values from a URL and check them.
04 · YOUR FIRST ROUTE
A Python function, available at a URL
GET /hello calls hello().
The function returns a dictionary. FastAPI sends it as JSON.
It also builds an interactive /docs page. Try our tide API.
from fastapi import FastAPI

app = FastAPI()

@app.get("/hello")
def hello():
    return {"message": "Hello"}
04 · BACKEND · PYTHON
Return the matching records
GET /tides?month=9
FastAPI reads month as an integer from 1 to 12.
Our function selects the records. FastAPI sends them as JSON.
@app.get("/tides")
def tides(
    month: int = Query(ge=1, le=12)
):
    return select_month(
        load_rows(), month
    )
04 · CONNECT THE TWO
Three things to check
address
The right endpoint
The frontend asks the Worker URL for /tides?month=9.
browser permission
The allowed origin
CORS lets the teaching site read the API response.
response
The expected shape
Each record has a month, a day and 24 heights.
04 · LIVE DATA · PYTHON IN THE BROWSER
Ask the deployed API for September
Run the request. Find how many days, which first date, and four heights in the reply.
04 · AN API CAN MAKE SOMETHING
This image came back from an API
A prompt went out. Image data came back.
Prompt: “Editorial paper sculpture of a tidal wave becoming a flowing ribbon…”
Qwen Image 2.1 · ComfyUI
Generated illustration · not measured tide data
04 · THE SAME REQUEST / RESPONSE PATTERN
A prompt goes in. An image comes back.
04 · READ THE IMAGE REQUEST
Describe the job in JSON
POST sends a job to the service.
model chooses the generator. prompt describes the image.
The script reads the API key from its environment.
{
  "model": "qwen-image-2.1",
  "prompt": "Editorial paper ...",
  "size": "1024x1024",
  "n": 1,
  "response_format": "b64_json"
}
04 · CLIENT AND SERVICE
In the tide app, what does the service send back?
A
The finished chart
B
JSON records
C
The mouse click
D
The PowerPoint
05
Test the API
One file. One feature. Red, then green.
05 · RED · WRITE THE TEST FIRST
One file checks the API
def test_september_tides():
    with urlopen(API) as response:
        assert response.status == 200
        rows = load(response)
    first = rows[0]
    assert (first["month"], first["day"]) == (9, 1)
    assert len(first["heights"]) == 24
    assert isinstance(first["heights"][0], float)
week04/tdd/test_api.py · run first: watch it fail.
05 · GREEN · ADD THE ROUTE
Return the data in that format
@app.get("/tides")
def tides(month: int):
    rows = load_rows()
    return [row for row in rows if row["month"] == month]
Source: week04/api.py · rerun test_api.py.
05 · THE LOOP
One promise, four steps
01
Write the test
Say what response would convince you.
02
See it fail
Read the failure: does it point to the missing feature?
03
Add the route
Implement the smallest change that meets the promise.
04
Run it again
The same test now passes.
06
Workshop
Try the demos, adapt an idea, then work on your assignment
06 · BEFORE YOU START
The tutorial is one continuous path
Use the first hour to try all the demo code: Streamlit with the local file, the browser/API request, the event-loop examples and the red-to-green API test.
Then adapt one idea to your own project. Use the final half-hour to work on Assignment 2.
06 · WORKSHOP
Two hours
0:00–1:00
Try every demo
Run the local-file Streamlit app, browser/API request, event-loop examples and red-to-green test. Change a value and inspect what happens.
1:00–1:30
Adapt what you learned
Bring one idea into your own project: add a useful control, respond to an event, show data or write a small check.
1:30–2:00
Work on Assignment 2
Last chance to ask tutors about your submission. Use the rest for your question, data, plot, README and PROCESS.md.
06 · ASSIGNMENT 2
Keep the data picture moving
Assignment 2 is due Sunday 4 October, 23:59.
This interface can help you explore your data. The submitted work still needs its own question, source, picture, README and PROCESS.md.
Every control should help someone see or ask something.
06 · ASSIGNMENT 2 · TEMPLATE CLINIC
Read the check in three groups
explain
README + process
150+ words, the picture shown, and a meaningful PROCESS.md.
reproduce
Code + data
Python parses, dependencies declared, raw data and picture committed.
show progress
Commit history
At least three commits across two or more days.
06 · ASSIGNMENT 2 · RUN IT LOCALLY
The same check, on your laptop
uv run https://raw.githubusercontent.com/sd5913/pfad/2026/assignments/check.py --assignment 2
Run from your assignment repo. Read the result, fix one item, then push again.
One control, one clear response
No class on 1 October · Assignment 2 due 4 October.
a·t4x
SD5913 · WEEK 04
One control, one clear response.
SD5913 · WEEK 04
01 Your first plot, and the final vote for our mark
02 Turn a picture into something a person can use
03 One action travels through a Streamlit app
04 Waiting, polling and callbacks
05 APIs: tide records and a generated image
06 One test, the workshop and Assignment 2
QUESTION · IMAGE UPLOAD
Caption, 50 characters or fewer: phenomenon · source
ClassPoint · image upload — answer on the projector
SD5913 · THE MARK
Mark 38
Score 4.04
28 wins · 5 losses · 33 comparisons
Mark 04
Score 3.40
27 wins · 6 losses · 33 comparisons
Mark 18
Score 3.01
26 wins · 7 losses · 33 comparisons
THE FINAL THREE
A — Mark 38
B — Mark 04
C — Mark 18
ClassPoint · multiple choice — answer on the projector
SD5913 · WEEK 04 · WORDS
More words appear when they have a job: sd5913.github.io/teaching/glossary.html
01
SEE THE COMPLETE INTERACTION BEFORE OPENING THE CODE
01 · THE WORKING APP
Choose a day. See its 24 hourly tide heights.
01 · THE SCOPE
01 · THE PROMISE
01 · INPUT, STATE, RESPONSE
A The mouse click
B 17
C The 24 plotted heights
D The JSON file
ClassPoint · multiple choice — answer on the projector
02
THE SELECTOR SUPPLIES A VALUE; THE CHART USES ONE RECORD
02 · MEET STREAMLIT
An open-source framework for turning Python scripts into interactive data apps.
Add controls, use their values, and show charts or tables.
Today: a month selector, a day selector, and a tide chart.
PROJECT streamlit.io
What it makes, with examples to explore.
SOURCE github.com/streamlit/streamlit
The code, issues, and release history.
Understand widgets and script reruns.
Find selectors, charts, and worked examples.
02 · THE PATH
INPUT
The day selector supplies 17.
STATE
The current run sees day = 17.
RESPONSE
The chart draws that record.
02 · THE EXACT CODE
17 — the selector returns a day.
One record — select_day finds it.
24 heights — the chart draws them.
day = st.selectbox(
"Day", [r["day"] for r in rows]
)
record = select_day(rows, day)
chart = pd.DataFrame(
{"Height (m)": record["heights"]},
index=range(1, 25),
)
st.line_chart(chart)
02 · STREAMLIT
When someone changes a selector, Streamlit runs the script again from top to bottom.
The widget keeps its selected value. During the new run, day contains that value, select_day returns a different record, and the chart is drawn again.
This rerun model belongs to Streamlit. Other interfaces handle events differently.
03
BLOCKING INPUT, A REPEATED CHECK, OR A RESPONSE FUNCTION
03 · BLOCKING INPUT
A command-line prompt stops at input() until a person answers.
That works for a short conversation. It does not work for a screen that must keep drawing or respond to other actions while it waits.
name = input("Name? ") print("Hello", name)
03 · POLLING
A loop checks input during each frame.
At 60 fps, the whole cycle has about 16.7 ms.
A slow update delays the next check and the next frame.
while running:
events = check_for_events()
update_state(events)
draw_frame()
03 · THE BROWSER EVENT LOOP
03 · CALLBACK
Event: the click.
Callback: update_chart.
The toolkit calls your function when the event arrives.
def update_chart(event): day = day_picker.value record = select_day(rows, day) chart.show(record) button.on_click(update_chart)
03 · THREE PATTERNS
COMMAND LINE
Ask once, then continue.
CONTINUOUS PICTURE
Check input during every frame.
DISCRETE ACTION
Run a function when an event arrives.
03 · WEEK 01 REVISITED
In week 1, this was a picture of a semester: keep working while the semester is on, then respond to the current problem and state.
Now the loop has a technical meaning. It checks a condition, updates values and decides what happens next.
while semester() == 1: problem = current_problem() try: problem.solve() except: simplify(problem)
03 · WAITING AND EVENTS
A Blocking input
B A callback
C A 60 fps loop
D A file refresh
ClassPoint · multiple choice — answer on the projector
04
TWO EXAMPLES, TWO DATA PATHS
04 · FRONTEND / BACKEND
04 · STREAMLIT · ONE PYTHON APP
04 · FRONTEND · JAVASCRIPT
Ask for September records.
Read the JSON reply.
Draw one day in the browser.
const response = await fetch( API + "/tides?month=9" ); const rows = await response.json(); const record = rows[0]; drawChart(record.heights);
04 · MEET FASTAPI
An open-source framework for building HTTP APIs in Python.
Connect a URL to a function, validate inputs, and return structured data.
Today: ask for a month and receive its tide records as JSON.
PROJECT fastapi.tiangolo.com
The framework and its documentation.
SOURCE github.com/fastapi/fastapi
The code, issues, and release history.
Create a route and explore the /docs page.
Query parameters and validation
Read values from a URL and check them.
04 · YOUR FIRST ROUTE
GET /hello calls hello().
The function returns a dictionary. FastAPI sends it as JSON.
It also builds an interactive /docs page. Try our tide API.
from fastapi import FastAPI app = FastAPI() @app.get("/hello") def hello(): return {"message": "Hello"}
04 · BACKEND · PYTHON
GET /tides?month=9
FastAPI reads month as an integer from 1 to 12.
Our function selects the records. FastAPI sends them as JSON.
@app.get("/tides") def tides( month: int = Query(ge=1, le=12) ): return select_month( load_rows(), month )
04 · CONNECT THE TWO
ADDRESS
The frontend asks the Worker URL for /tides?month=9.
BROWSER PERMISSION
CORS lets the teaching site read the API response.
RESPONSE
Each record has a month, a day and 24 heights.
04 · LIVE DATA · PYTHON IN THE BROWSER
Run the request. Find how many days, which first date, and four heights in the reply.
04 · AN API CAN MAKE SOMETHING
A prompt went out. Image data came back.
Prompt: “Editorial paper sculpture of a tidal wave becoming a flowing ribbon…”
Qwen Image 2.1 · ComfyUI
Generated illustration · not measured tide data
04 · THE SAME REQUEST / RESPONSE PATTERN
04 · READ THE IMAGE REQUEST
POST sends a job to the service.
model chooses the generator. prompt describes the image.
The script reads the API key from its environment.
{
"model": "qwen-image-2.1",
"prompt": "Editorial paper ...",
"size": "1024x1024",
"n": 1,
"response_format": "b64_json"
}
04 · CLIENT AND SERVICE
A The finished chart
B JSON records
C The mouse click
D The PowerPoint
ClassPoint · multiple choice — answer on the projector
05
ONE FILE. ONE FEATURE. RED, THEN GREEN.
05 · RED · WRITE THE TEST FIRST
def test_september_tides(): with urlopen(API) as response: assert response.status == 200 rows = load(response) first = rows[0] assert (first["month"], first["day"]) == (9, 1) assert len(first["heights"]) == 24 assert isinstance(first["heights"][0], float)
week04/tdd/test_api.py · run first: watch it fail.
05 · GREEN · ADD THE ROUTE
@app.get("/tides") def tides(month: int): rows = load_rows() return [row for row in rows if row["month"] == month]
Source: week04/api.py · rerun test_api.py.
05 · THE LOOP
01 Write the test
Say what response would convince you.
02 See it fail
Read the failure: does it point to the missing feature?
03 Add the route
Implement the smallest change that meets the promise.
04 Run it again
The same test now passes.
06
TRY THE DEMOS, ADAPT AN IDEA, THEN WORK ON YOUR ASSIGNMENT
06 · BEFORE YOU START
Use the first hour to try all the demo code: Streamlit with the local file, the browser/API request, the event-loop examples and the red-to-green API test.
Then adapt one idea to your own project. Use the final half-hour to work on Assignment 2.
06 · WORKSHOP
0:00–1:00
Try every demo
Run the local-file Streamlit app, browser/API request, event-loop examples and red-to-green test. Change a value and inspect what happens.
1:00–1:30
Adapt what you learned
Bring one idea into your own project: add a useful control, respond to an event, show data or write a small check.
1:30–2:00
Work on Assignment 2
Last chance to ask tutors about your submission. Use the rest for your question, data, plot, README and PROCESS.md.
06 · ASSIGNMENT 2
Assignment 2 is due Sunday 4 October, 23:59.
This interface can help you explore your data. The submitted work still needs its own question, source, picture, README and PROCESS.md.
Every control should help someone see or ask something.
06 · ASSIGNMENT 2 · TEMPLATE CLINIC
EXPLAIN
150+ words, the picture shown, and a meaningful PROCESS.md.
REPRODUCE
Python parses, dependencies declared, raw data and picture committed.
SHOW PROGRESS
At least three commits across two or more days.
06 · ASSIGNMENT 2 · RUN IT LOCALLY
uv run https://raw.githubusercontent.com/sd5913/pfad/2026/assignments/check.py --assignment 2
Run from your assignment repo. Read the result, fix one item, then push again.
No class on 1 October · Assignment 2 due 4 October.